
Data Scientist | Biostatistician | Epidemiologist
Veterans Health Administration |
Ph.D., RAND Graduate School | MPH, Yale University
The Building Blocks:
GitHub Codes | Visual Dashboards |Qualitative Interview Guides
My left brain and right brain are equally expressive. They need room to play.
The building blocks of my quantitative work can be found in the scripts containing codes on my GitHub page (link below).
You can also find examples of dashboards of visuals I built and qualitative interviews that I designed and conducted below.
Quantitative Methods
Within quantitative research, I move between multiple programming languages, tools, and techniques, driven by the research aims, questions, and project constraints. For advanced statistical analysis such as ordinal and multinomial regressions, and data visualization, I mostly use R and sometimes, Power BI and Tableau (examples of dashboards below). For propensity-score matching analysis, I use STATA. For data query and retrieval and exploratory data analysis, I use SQL. For data wrangling, I use R and Python.
The scripts containing my codes can be found on my GitHub page.

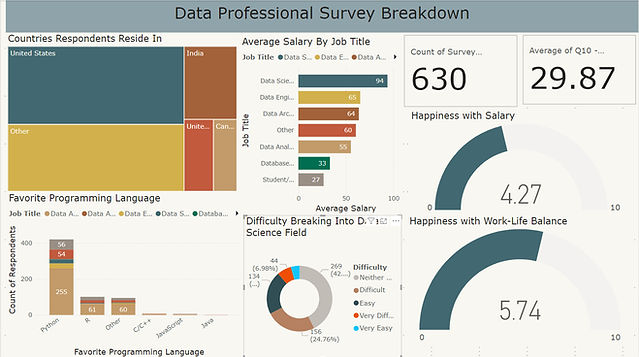
Visualizations
Examples of dashboards with visuals that I built in PowerBI and Tableau are to the right and below.

Qualitative Methods
In my qualitative work, I carry out the projects from end to end:
I develop the interview guides, conduct the interviews, and lead the data analysis, mainly in Atlas.ti.
You can find interview guides I conducted with physicians and with patients and their caregivers.
